Country correction
This page explores how the size of the country can be taken into account in the determination of the eco-score transport bonus.
Bonus approach
The eco-score approach intends to give a bonus to locally produced (and purchased) products. This bonus is +15, which is equal to a transport score of 100. This bonus is however now given to any product produced/purchased in France. No account has been taken of the very large size of France and impact of transport within the country.
Can this approach be adapted, so that the size of a country is taken into account?
It would be more logic to give the maximum bonus (transport score of 100) only to very local production and purchase. Ideally this will imply an area as small as possible, i.e. a city or very small country. Production and purchase that occurs in a country such as Andorra, Monaco, Liechtenstein or San Marino could be viewed as having a transportation score of 100.
In the current calculation the no bonus (transportation score 0) is (arbitrarily) set at a distance of 2000 km. This distance covers roughly the size of Europe.
Centroids to the rescue?
Is it possible to use the centroid calculations in determining the (transportation) size of a country?
The weighted sum for a country that consists of single city will be zero. This means there is no transportation required. The country size is then zero.
The centroid approach can be used to calculate the country transportation size. We just have to add all cities, so that the entire population is covered. The resulting weighted distance is the size we are looking for. This size is the average distance to the entire population.
How can the centroid data be used and does it need to be extended?
Approach
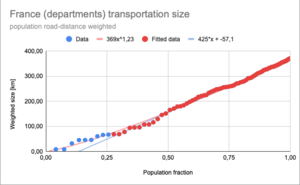
In the figure the weighted distances for France using the departments are shown.
The cumulative population road-distance weighted distances are plotted against the cumulative population ratios. Each added city adds a point, increasing the cumulative population ratio and the cumulative distance. If the cumulative population ratio is 1, we have covered the entire population. And the corresponding cumulative distance is the value we are looking for.
Fit function
Adding all the cities is to much work. Instead of adding all the cities, we could fit a line to the data of a few city points. The cumulative distance of the fit at a population ratio of 1, is then again the value we are looking for.
The function to fit must behave nicely with extrapolations. This excludes complex functions with many parameters. Or functions which behave not regular outside the fitted points (polynomials).
This leaves the following functions in Google Sheets:
- linear - results in average values;
- logarithmic - results in smaller values;
- power functions - results in larger values, but goes through the origin (0,0);
The results of France show that the logarithmic function does not fit the data. The best fit is provided by a power function {f(x)=axb}. However the fit works only if there is enough data above a population fraction of 25%. The data below 25% heavily influences the outcome of a power functions. As an approximation a linear fit can be used, without using the data at low ratios (<25%). For France in fact the results are the close (371 and 363).
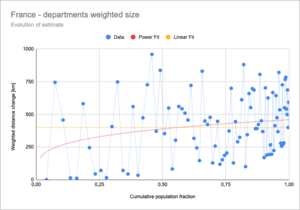
This suggests that the slope of a linear function is the same as the power function for the fitting purpose. To see this better a change (derivative) can be plotted.
As can be seen from the graph the slope does not stay constant as more and more departments are added. At this close inspection the power function fit is better. The linear fit to the slope (not the original data) confirms this conclusion and provides a better fit.
Accuracy
The conclusion is that the power function gives the best result for a country when we have 100% of the data, i.e. up to a population ratio of 1. At what population ratio do we get an estimate of the weighted country size that is good enough. We can define good enough as within 10%.
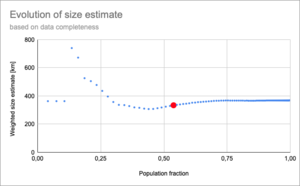
So for France this will be at 380 ± 40. The evolution of the size estimates as departments are added and the population ratio increases is shown below.
The red dot shows where the estimate is within 10% of the final value. So this occurs well above a population ratio of 50%. If we accept an error of 20%, a population ratio of at least 30% is required.
These graphs might be a good tool to see when the estimate converges.
In order to get a good population coverage, it must also be decided which territory units to chose (city, municipalities, agglomerations, cantons, election area's, provinces, regions, etc). If the units are to large, the accuray for centroid and size will be not very accurate. If the unit is to small, we might miss out on population (countryside versus city) and we need a lot of data (are there European databases that could help?). A drawback is that adjusted centroids need to be calculated.
Result
This approach has been applied on the following countries with a power function:
| Country | Centroid city | size | spreadsheet |
|---|---|---|---|
| Albania | Tirana | 100 | link |
| Algeria | Algers | 370 | link |
| Austria | Vienna | 230 | link |
| Belgium | Brussels | 86 | link |
| Belgium - provinces | Brussels | 75 | [link https://docs.google.com/spreadsheets/d/1oawted6mzxobb7FVsfyP1FgoGalEzxPBBgriLYPoOys/ ] |
| Bosnia and Herzegovina | Zenica | link | |
| Croatia | Zagreb | 160 | link |
| Czech Republic | Prague | link | |
| Denmark | Copenhagen | 170 | link |
| Estonia | Tallinn | 120 | link |
| Finland | Helsinki | 220 | link |
| France - cities | Paris | link | |
| France - departments | Paris | 369 | link |
| Germany | Hannover | 260 | link |
| Greece | Athens | link | |
| Hungary | Budapest | 120 | link |
| Iceland | Reykjavik | 90 | link |
| Ireland | Dublin | 100 | link |
| Italy | Rome | 520 | link |
| Italy provinces | Bologna | 400 | link |
| Latvia | Riga | 77 | link |
| Lithuania | Kaunas | 120 | link |
| Montenegro | Bijelo Polje | link | |
| Morocco | Temara | 230 | link |
| Netherlands | Utrecht | 72 | link |
| Norway | Skien | 300 | link |
| Poland | Łódź | 240 | link |
| Portugal | Lisboa | 140 | link |
| Romania | Bucharest | 300 | link |
| Slovakia | Banská Bystrica | 78 | link |
| Slovenia | Ljubljana | 66 | link |
| Spain | Madrid | 430 | link |
| Sweden | Nörrköping | 270 | link |
| Switzerland | Olten | 120 | link |
| Tunisia | Tunis | link | |
| United Kingdom | Coventry | 210 | link |
| European Union | Munich | link | |
| Bouches du Rhône | Marseille | 22 | link |
Values in italic need more data. For some large countries another organisational unit is required to get better sizes. They accuracy of the results needs to be added.
Comments
Some observations on individual countries.
Conclusion
The graph below shows the size of each country based on population road-distance weighted transportation distance. The location of the circles is on the country centroid.
So what to do with this data? The idea is to extend the ecoscore to other countries. A consistent approach should allow comparison between countries and favorise local production and consumption.
How the transportation is incorporated depends on what the ecoscore wants achieve. There seem to be three approaches.
Real approach
This approach tries to calculate the true impact of the transportation by looking at the carbondioxide emission. The lifecycle values for each product incorporate already the impact of distribution for France. Thus we need to adjust this impact for other countries by subtracting the impact for France and adding the other country.
If the detailed lifecycle data is available, we can just divide the distribution fraction by the size of France and multiply with the size of the other country. This implies that the same product will have a lower lifecycle value in, for example Belgium, than in France. For very small territories the distribution fraction will be reduced to zero.
Drawback of this approach is that the distribution part of the lifecycle is not emphasised. But then it is only a small part if the total lifecycle value.
Bonus approach
The bonus approach emphasises the consumption of locally produced products. The closer the production to consumption the better. So if no transportation is required, a maximum number of points is awarded. In this way small territories and countries get the maximum bonus. This bonus is scaled down by the country size for products produced within a country.
But to do correct scaling, it is also required to define a maximum distance at which the bonus becomes zero. Ecoscore now uses 2000 km for this (seems large). The formula to calculated the standard bonus is then:
Bonus(country) = ( 1 - size(country) / maximum distance ) * 15
Implementing this for ecoscore would imply a bonus of ? for France instead of the currently used 15 points.
Note that any transportation of a product between countries of territories would reduce the bonus. Also if we would use country subdivisions as territories and transport between these subdivisions, we would get a more realistic bonus. And it would be better than using these average country sizes.
Ecoscore approach
The ecoscore is developed for France and favorises products from France. To achieve this a bonus is given to any product produced in France of 15 points, which corresponds to a distance of 1000 km (?). This is much larger than the size of France by the way.
So what to do with small countries, which have a much smaller transportation impact? Increase the bonus?


